
The Matrix Map: A Powerful Tool for Mission-Focused Nonprofits
This article is adapted from sections in Nonprofit Sustainability: Making Strategic Decisions for Financial Viability by Jeanne Bell, Jan Masaoka, and Steve Zimmerman. It was originally posted on blueavocado.org in two parts and published by Nonprofit Quarterly on April 1st, 2014.
PART ONE: How to Create the Matrix Map
It’s easy to embrace the concept of the Dual Bottom Line, but harder to apply it in a real-world board setting. For example, board members—and many staff—are seldom familiar with all of the programs and activities of the organization. While there may be a strong sense that “all our programs are great,” there may not have been any discussion about which programs are, in fact, those with the greatest or most important impacts. Even people with financial expertise may feel uncertain about how to make decisions that are more nuanced than “stick to the budget and at least break even.”
Board meetings unintentionally support this kind of fragmentation. They take each subject on its own: first the financial report, then the program report, and then the fundraising report. The Matrix Map aims to change that.
The Matrix Map is a visual tool that plots all of the organization’s activities—not just its programs—into a single, compelling image. By illustrating the organization’s business model—through a picture of all activities and the financial and mission impact of each one—it supports genuinely strategic discussions.
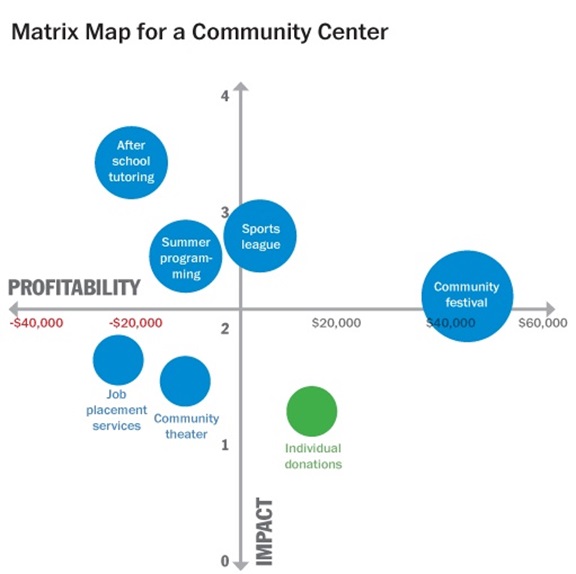
Below is an example of a Matrix Map for a community center. Each circle represents a business line. You can see that circles higher on the map have higher impact than those lower on the map. You can see the relative size of each activity, and which ones make money, which break even, and which require subsidy from the organization’s unrestricted funds.
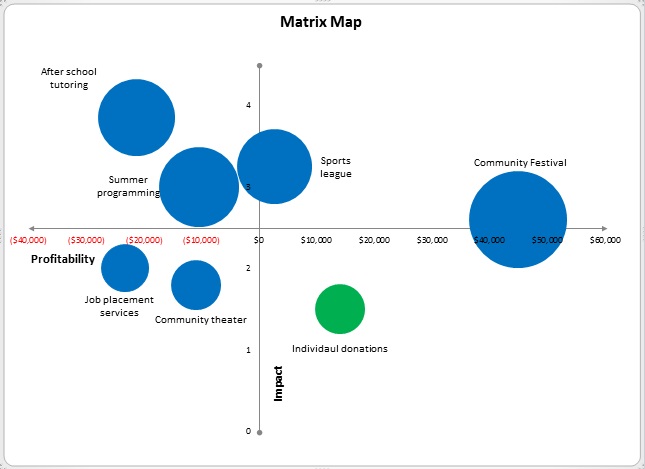
The resulting image often provides an “Aha!” moment for board members. After years of hearing about seemingly unrelated programs, they can now understand how they all work together to support the impact and viability of the organization they care about.
How to make a Matrix Map of your organization
To create a Matrix Map there are four steps:
- Identify your “lines of business” or activities
- Assess relative mission impact
- Determine profitability and
- Map the results!
Here is a more thorough explanation of each step:
1. Identify your business lines—all of them: A business line is a programmatic or fundraising activity in your organization that requires effort. Counseling, dance performances, citizenship classes, and forest restoration are all business lines. A fundraising phone-a-thon is a line of business, as is a special event or major donor solicitation.
2. Assess relative mission impact: In many nonprofits, there’s an implicit assumption that all programs are effective and important—and that’s typically true. But everyone also realizes—yet seldom says—that some programs have higher impact than others. We may not discuss impact levels in order not to sound as if we are criticizing a worthwhile program (or its director), but it’s precisely these judgments about which programs have the highest impact that the management team and the board should discuss as strategic choices are made.
Each organization will have different criteria for impact—after all, impact is defined by each nonprofit differently. And remember, this is an informed self-assessment, not an evaluation. We suggest a survey or discussion with the management team and the board that asks individuals or the group to rate each business line on a scale of 1 to 4 using four criteria. Organizations can identify their own criteria for impact; here are a few we’ve found useful:
- Alignment with core mission: How closely does this program align with our core goals? Some programs may be excellent, but not as central to our mission.
- Excellence in execution: Organizations are simply better at delivering some activities than others. A business line may be important to our mission, but we may not have the right skills or financial resources to implement it with excellence. This is a nice way of separating planning from execution.
- Scale: How many people does each business line affect?
- Depth: How deep an intervention or contact does each business line provide?
- Building community or constituency: How does this business line contribute to building, for example, the environmental movement or the Hillside Neighborhood (not just our organization)?
- Fills an Important Gap (FIG): If a business line were to go away, would your constituents be able to go across the street to another agency or would they have nowhere to go?
Remember, you only need to choose four or five criteria and you don’t need to use any of these suggestions. After you’ve rated all of the business lines, take an average of the scores each line receives across the criteria and that will be its mission impact score. For example, if tutoring were to receive the following scores:
- Alignment with Impact: 4
- Excellence in Execution: 3
- Fills an Important Gap: 3
- Building Community or Constituency: 2
The mission impact score would be the average: 3.0.
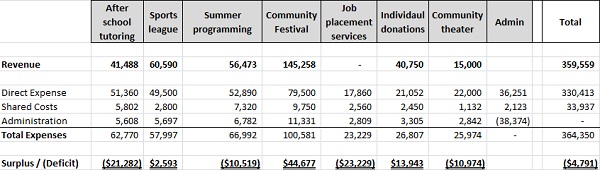
3. Determine the profitability of each business line: Look at how much a business line is contributing financially (profit) or how much it needs subsidy from the organization’s unrestricted funds (loss). (Unrestricted revenue should be attributed to the fundraising vehicle [business line] that was used to raise it, such as major donors or direct mail.)
4. Map the results: Once these steps are done, you can map each business line on a grid. We put impact on the vertical axis (x axis) and profitability on the horizontal axis (y axis).
Here you see the Excel worksheet:
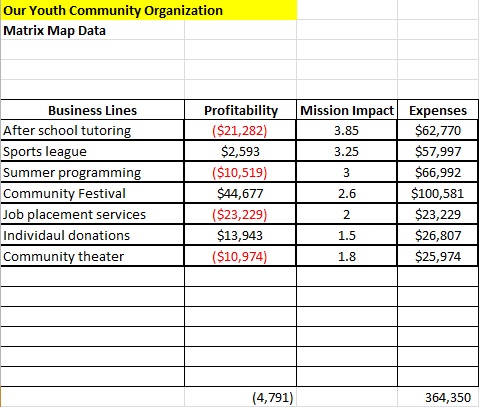
Then using Excel’s chart function, select “Bubble Chart” to create the Matrix Map seen at the beginning of this article.
More than just a picture, though, the Matrix Map can help engage board members in strategic discussions about how to strengthen the organization’s business model – understanding that the implications of their decisions will affect both impact and finances. And staff can see the whole organization at a glance in a way that focuses attention on activities and impact rather than as an organization chart.
PART TWO: Strategic Imperatives
For many board members, the Matrix Map provides sudden clarity on how the organization’s different activities inter-relate. But beyond helping them understand the business model, the Matrix Map can help nonprofit leaders strengthen it.
You’ll recall that putting together a Matrix Map calls for plotting your organization’s business lines according to their mission impact and financial profitability. Depending on where an activity is placed on the map, a strategic imperative emerges. These strategic imperatives are the actions that would most likely strengthen the business model and increase the organization’s sustainability.
The Matrix Map below for a community center shows that the after-school tutoring program has the highest impact and is subsidized by the community festival and individual donations. The map showcases the integration between mission impact and financial profitability, or what is sometimes called the dual-bottom line of nonprofits.
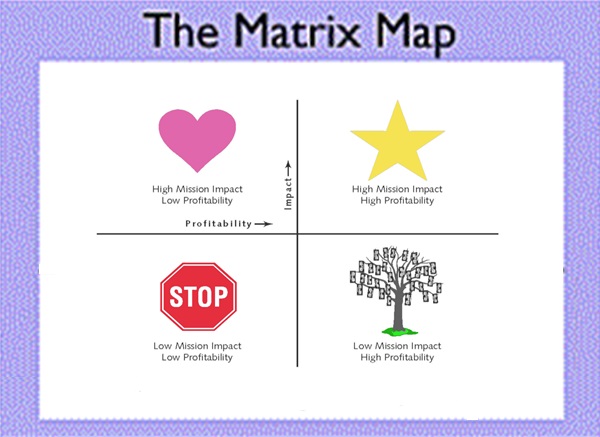
For each quadrant of the Matrix Map, the strategic imperatives are as follows:
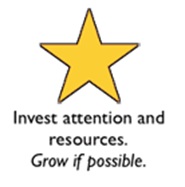
a. High Impact, High Profitability: the Stars (upper right corner)
In many organizations the programs that are high performing and highly funded appear to almost “run themselves.” They are rarely in crisis mode and can take up little time from the executive director because they are performing so well. That is also the temptation: with so many other areas in need of strengthening, why should we focus on a strong program?
The strategic imperative for Stars is exactly the opposite: Rather than turning away from Stars to pay attention to problem areas, leaders must invest their time and attention and financial resources in order to grow them. When we are choosing which areas to grow, the first (not the only) choices must be those that are our highest impact, financially viable programs and activities.
Note that not all Stars are programs. For instance, a strong annual fundraising dinner may be a Star: it may raise crucial unrestricted funds, convene and celebrate the organization’s constituency (such as a neighborhood, people working on minimum wage levels, a dance troupe, etc.), and bring visibility to the organization and its work.
For the community center, the Stars are the sports league and community festival.
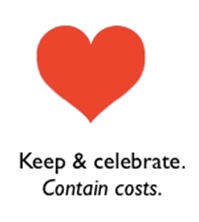
b. High Impact but Low Profitability: the Hearts (upper left corner)
Nonprofit organizations are filled with activities that directly help us accomplish our mission but lose money. They may not be suitable for earned income, or they may be too controversial or new to be able to fund. Such programs require subsidy from the organization’s unrestricted funds. We call these activities Hearts.
The strategic imperative for Hearts is to keep them, but to contain their costs. Not every activity needs to break even. For most nonprofits, being able to provide services that lose money is important to mission. We want Hearts, but we can’t allow them to drive the organization into bankruptcy. For a social service organization, containing costs may mean reducing the level of service or limiting the number of people who can be served. Every program needs a limit for how much unrestricted subsidy it gets from the organization. The temptation may be simply to raise more money, but fight this urge. Organizations can afford some Hearts, but too many make it unsustainable.
For the community center, the afterschool tutoring and summer programming are hearts. These programs were what the organization was founded around, but as they have aged they have lost foundation funding and have no earned revenue strategy.
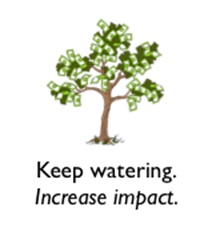
c. Low Impact, High Profitability: the Money Trees (lower right corner)
Opposite the Hearts are our Money Trees, those activities that are lower in impact and generate surpluses usually used to subsidize the Hearts. They typically include our fundraising vehicles such as golf tournaments, raffles, and galas, as well as commercial activities such as parking lot rental income or food sales.
The strategic imperative for a Money Tree is to keep it, nurture it, and increase its impact. We often neglect Money Trees and expect them to continuously produce income year after year. But just like real trees, Money Trees require care and attention to stay fresh, stay healthy, and grow.
It is also common to think of our Money Trees in only one frame: the amount of money generated. The strategic imperative reminds us we should also look at them as a way of increasing our impact. Money Trees create awareness and at a minimum provide an opportunity to educate audiences about the importance of your mission. This should be nurtured and looked after as well.
Individual donations represent the Money Tree for the community center.
d. Low Impact, Low Profitability: the Stop Signs (lower left corner)

Most organizations have a few activities that not only lose money but are also low impact. They are the activities that consume time and energy as we rework them yet again, trying to improve the marketing or search for a funding source. Common examples are poorly attended workshops, stale fundraising events, un-used resource libraries, and outdated “pet projects.”
The strategic imperative for these Stop Signs is to close them or give them away to another organization. It’s not that these activities are useless, but they may be taking more of our resources than they warrant. The Matrix Map looks at relative impact and raises the question of opportunity cost. What if we invested the resources we spent on our low-impact program on one of our Stars? What if the time and attention our Stop Sign requires were focused on our Money Trees?
For the community center, the job placement services and community theater represent Stop Signs. Job services were initiated by the organization when they saw a community gap. Since then a vocational service center has opened with a more comprehensive program and better attendance. In terms of the community theatre: the center took this on when the local theatre closed its doors. Unfortunately, despite the desire to support the theatre, the center has not been able to strengthen programming enough to attract either audience or funding.
The imperatives for Stop Signs are often the hardest to implement because they involve letting go of something that was once a great idea. But the strategic imperative can also be a relief. Rather than admitting failure, we’re focusing on our strengths and building a stronger, more sustainable organization. As part of this strategic imperative we should look around our community and ask who else is providing this service. It may be possible that another organization is offering a similar program that is stronger. By referring our constituents to them everyone may benefit.
Looking at the choices in context of the whole
Taken together, the strategic imperatives offer choices towards increased sustainability. These choices are not easy to make, nor can they be made “once and for all.” What is sustainable is constantly changing as the environment in which we operate is constantly changing. Funding sources may shift, and constituents’ needs may shift; what was once a Star may now be a Stop Sign. We must continually shift our programmatic and revenue strategies for our organizations to remain viable.
Making strategy choices require judgment. The Matrix Map is a tool for board members and staff to make judgments informed by impact and finance, and in the context of the whole organization. Strategic imperatives provide a common ground for discussing the choices that face the activities in each quadrant of the map. And ultimately, making strategic decisions about each business line is what leads an organization towards a more sustainable future.
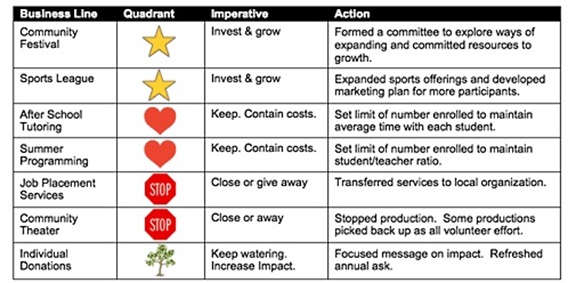
For years, the community center had been discussing expanding their after-school tutoring. The Matrix Map helped them realize that they couldn’t expand it, lose more money, and still be sustainable. Rather, they remained committed to offering both after-school tutoring and summer programming at the same level of enrollment. They transferred their job placement services to another agency in town and used the money they saved to explore ways to increase the impact of the summer programming. They shut down the community theater and expanded their sports league by offering more sports and increasing marketing to draw participants. Lastly, by continuing to nurture and grow their community festival, they augmented its impact and secured their place in sponsoring the festival for years to come.
These are not easy decisions with easy answers. Rather, the answer is often unclear. The Matrix Map offers a way to engage the entire board in the discussion, drawing on everyone’s minds. And ultimately, making strategic decisions about each business line is what leads an organization towards a more sustainable future.